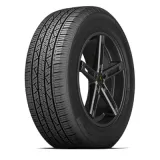
Tests 59 · 1 test Owners 78 · 26 reviews
Head-to-head
Updated
Continental CrossContact LX25 vs Continental SportContact 2 SSR Run Flat — Compared
Relative Score (0–100): 60% professional tests, 40% owner reviews.
CrossContact LX25 is ahead, 76–69
Add your size for an exact match
/R
Both Amazon links then search this exact size.
TireWheelGuide may earn a commission from purchases made through these links.
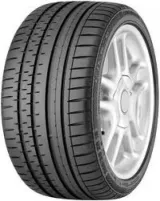
Tests – · none yet Owners 69 · 7 reviews
Category by category
Relative Score per category, 0–100. Open “Why this score” for the tests and owner ratings behind it.
-
75
Dry
CrossContact LX25 +570Why this score
Source CrossContact LX25 SportContact 2 SSR Run Flat Professional tests (TWG score) 70 – Reviews found online 83 72 -
79
Wet
CrossContact LX25 +772Why this score
Source CrossContact LX25 SportContact 2 SSR Run Flat Reviews found online 82 73 -
53
Snow
No comparison–Why this score
Source CrossContact LX25 SportContact 2 SSR Run Flat Professional tests (TWG score) 40 – Reviews found online 72 – -
74
Comfort
CrossContact LX25 +866Why this score
Source CrossContact LX25 SportContact 2 SSR Run Flat Reviews found online 79 63 -
71
Noise
No comparison–Why this score
Source CrossContact LX25 SportContact 2 SSR Run Flat Reviews found online 77 – -
71
Treadwear
CrossContact LX25 +863Why this score
Source CrossContact LX25 SportContact 2 SSR Run Flat Reviews found online 75 61 -
79
Handling
CrossContact LX25 +772Why this score
Source CrossContact LX25 SportContact 2 SSR Run Flat Reviews found online 79 72
Scores at a glance
| Category | Continental CrossContact LX25 | Continental SportContact 2 SSR Run Flat |
|---|---|---|
| Relative Score | 76 | 69 |
| Dry | 75 | 70 |
| Wet | 79 | 72 |
| Snow | 53 | – |
| Comfort | 74 | 66 |
| Noise | 71 | – |
| Treadwear | 71 | 63 |
| Handling | 79 | 72 |
Higher is better. The Relative Score follows your weights below; category scores do not change.
Weight the categories that matter to you
Wet grip and treadwear start at “Important” — the two things buyers rank highest. Move the sliders and the scores update instantly.
Important
NoneLessNeutralMoreMost
Important
NoneLessNeutralMoreMost
Neutral
NoneLessNeutralMoreMost
Neither tire has a score here yet, so this weight changes nothing.
Less important
NoneLessNeutralMoreMost
Less important
NoneLessNeutralMoreMost
Neither tire has a score here yet, so this weight changes nothing.
Important
NoneLessNeutralMoreMost
Neutral
NoneLessNeutralMoreMost
Recomputed
Headline score
76
/ 100
CrossContact LX25
69
/ 100
SportContact 2 SSR Run Flat
Only categories both tires have data for count toward the headline score.
Pros, cons & observations
Themes extracted from owner reviews found online — not the opinion of TireWheelGuide.
Tire A CrossContact LX25
Pros
- Extremely quiet and smooth ride quality at all speeds
- Significantly improved wet and snow traction
- Enhanced braking performance and responsiveness
Cons
- Tends to pick up and throw gravel from the road surface
- Can feel a bit harsh or firm when hitting deep potholes
- Occasional reports of unexpectedly rapid treadwear in rare instances
Tire B SportContact 2 SSR Run Flat
Pros
- Strong wet and dry traction performance
- Improved ride comfort compared to competing run-flat brands
- Respectable tread longevity for some users
Cons
- Tendency for uneven tread wear
- Increased road noise as the tire ages
- Harsh ride quality on low-profile, staggered setups
Specs side by side
| Attribute | A · Continental CrossContact LX25 | B · Continental SportContact 2 SSR Run Flat |
|---|---|---|
| Category | All Season | Summer |
| Vehicle type | SUV and 4x4 | Passenger Car / Crossover |
| Sizes available | 40 | — |
| Rim diameters | 16″ – 22″ | — |
| Tread depth | 10 - 12/32″ | — |
| UTQG | 740 A A - B | — |
| Sidewall | Black Side Wall - Raised Outline White Lettering | — |
| Max pressure | 44 - 51 psi | — |
Which one should you actually buy?
76
/ 100
Continental CrossContact LX25
69
/ 100
Continental SportContact 2 SSR Run Flat
Winner: Continental CrossContact LX25 — better comfort, treadwear and wet. It leads or ties in every category we score.
Pick tire A
You want the most comfortable ride
Continental CrossContact LX25 scores 74 vs 66 on comfort.
Pick tire A
You want the longest tread life
Continental CrossContact LX25 scores 71 vs 63 on treadwear.
Pick tire A
Your priority is wet-weather safety
Continental CrossContact LX25 scores 79 vs 72 on wet.
Pick tire A
You enjoy sharp, responsive handling
Continental CrossContact LX25 scores 79 vs 72 on handling.
Tire A · Continental CrossContact LX25
Tire B · Continental SportContact 2 SSR Run Flat
TireWheelGuide may earn a commission from purchases made through these links.
How do we compare tires?
Every category score blends two independent signals. 60% comes from professional tire tests (braking distances, lap times, noise measurements), each result compared with every other tire in the same test and newer tests counting more. 40% comes from owner reviews found online, adjusted for how generously each site rates. Both use one scale: the average tested tire gets 70, the best 100. When a tire has only one of the two, the missing half is estimated from the other and the score stays closer to average; with no road test and fewer than five owner reviews it gets no score yet.
Community buzz from Reddit and forums is shown for context only — it never changes the score.