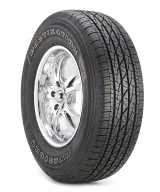
Tests – · none yet Owners 67 · 102 reviews
Head-to-head
Updated
Firestone Destination LE2 vs Goodyear Assurance WeatherReady 2 — Compared
Relative Score (0–100): 60% professional tests, 40% owner reviews.
Assurance WeatherReady 2 is ahead, 76–67
Add your size for an exact match
/R
Both Amazon links then search this exact size.
TireWheelGuide may earn a commission from purchases made through these links.
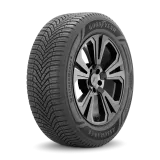
Tests 74 · 2 tests Owners 79 · 129 reviews
Category by category
Relative Score per category, 0–100. Open “Why this score” for the tests and owner ratings behind it.
-
67
Dry
Assurance WeatherReady 2 +1077Why this score
Source Destination LE2 Assurance WeatherReady 2 Professional tests (TWG score) – 74 Reviews found online 67 81 -
69
Wet
Assurance WeatherReady 2 +1079Why this score
Source Destination LE2 Assurance WeatherReady 2 Professional tests (TWG score) – 74 Reviews found online 69 87 -
66
Snow
Assurance WeatherReady 2 +1076Why this score
Source Destination LE2 Assurance WeatherReady 2 Professional tests (TWG score) – 79 Reviews found online 63 72 -
66
Comfort
Assurance WeatherReady 2 +975Why this score
Source Destination LE2 Assurance WeatherReady 2 Reviews found online 64 81 -
68
Noise
Level68Why this score
Source Destination LE2 Assurance WeatherReady 2 Professional tests (TWG score) – 63 Reviews found online 71 75 -
67
Treadwear
Assurance WeatherReady 2 +673Why this score
Source Destination LE2 Assurance WeatherReady 2 Reviews found online 67 77 -
68
Handling
Assurance WeatherReady 2 +775Why this score
Source Destination LE2 Assurance WeatherReady 2 Reviews found online 68 75
Scores at a glance
| Category | Firestone Destination LE2 | Goodyear Assurance WeatherReady 2 |
|---|---|---|
| Relative Score | 67 | 76 |
| Dry | 67 | 77 |
| Wet | 69 | 79 |
| Snow | 66 | 76 |
| Comfort | 66 | 75 |
| Noise | 68 | 68 |
| Treadwear | 67 | 73 |
| Handling | 68 | 75 |
Higher is better. The Relative Score follows your weights below; category scores do not change.
Weight the categories that matter to you
Wet grip and treadwear start at “Important” — the two things buyers rank highest. Move the sliders and the scores update instantly.
Important
NoneLessNeutralMoreMost
Important
NoneLessNeutralMoreMost
Neutral
NoneLessNeutralMoreMost
Less important
NoneLessNeutralMoreMost
Less important
NoneLessNeutralMoreMost
Important
NoneLessNeutralMoreMost
Neutral
NoneLessNeutralMoreMost
Recomputed
Headline score
67
/ 100
Destination LE2
76
/ 100
Assurance WeatherReady 2
Pros, cons & observations
Themes extracted from owner reviews found online — not the opinion of TireWheelGuide.
Tire A Destination LE2
Pros
- Excellent dry and wet traction
- Affordable, high-value pricing
- Quiet and comfortable highway ride
Cons
- Tendency to pick up and retain small stones from gravel roads
- Occasional reports of higher-than-expected road noise on specific vehicle models
- Isolated instances of balancing difficulties or premature wear
Tire B Assurance WeatherReady 2
Pros
- Exceptional wet weather grip and performance
- Strong traction and handling in snow and winter conditions
- Smooth and comfortable ride quality over rough pavement
Cons
- Noticeable reduction in fuel economy or EV range
- Potential for mild tread hum or road noise as mileage increases
- Higher initial purchase price compared to standard all-season tires
Specs side by side
| Attribute | A · Firestone Destination LE2 | B · Goodyear Assurance WeatherReady 2 |
|---|---|---|
| Category | — | All Weather |
| Vehicle type | — | Passenger Car / Crossover |
| Sizes available | 5 | 78 |
| Rim diameters | 16″ – 18″ | 16″ – 22″ |
| Tread depth | 11/32″ | 11/32″ |
| UTQG | 520 A B | 700 A A |
| Treadwear warranty | 60,000 mi | 60,000 mi |
| Sidewall | Blackwall | Vertical Serrated Band |
| Max pressure | 44 psi | 50 - 51 psi |
Which one should you actually buy?
67
/ 100
Firestone Destination LE2
76
/ 100
Goodyear Assurance WeatherReady 2
Winner: Goodyear Assurance WeatherReady 2 — better dry, wet and snow. It leads or ties in every category we score.
Pick tire B
You want the most grip on dry roads
Goodyear Assurance WeatherReady 2 scores 77 vs 67 on dry.
Pick tire B
Your priority is wet-weather safety
Goodyear Assurance WeatherReady 2 scores 79 vs 69 on wet.
Pick tire B
You drive through snowy winters
Goodyear Assurance WeatherReady 2 scores 76 vs 66 on snow.
Pick tire B
You want the most comfortable ride
Goodyear Assurance WeatherReady 2 scores 75 vs 66 on comfort.
Tire A · Firestone Destination LE2
Tire B · Goodyear Assurance WeatherReady 2
TireWheelGuide may earn a commission from purchases made through these links.
How do we compare tires?
Every category score blends two independent signals. 60% comes from professional tire tests (braking distances, lap times, noise measurements), each result compared with every other tire in the same test and newer tests counting more. 40% comes from owner reviews found online, adjusted for how generously each site rates. Both use one scale: the average tested tire gets 70, the best 100. When a tire has only one of the two, the missing half is estimated from the other and the score stays closer to average; with no road test and fewer than five owner reviews it gets no score yet.
Community buzz from Reddit and forums is shown for context only — it never changes the score.