Tests – · 1 test Owners 69 · 1 review
Best test result: #1 of 8 in 2022 Consumer Reports All-Season Tires (tested tread life (miles))
Relative Score (0–100): the weighted average of the categories below, each 60% road tests and 40% owner reviews (comfort 40/60). Based on 1 + 0 road tests and 1 + 205 owner reviews. How we score
Defender T+H is ahead, 71–64
Both Amazon links then search this exact size.
TireWheelGuide may earn a commission from purchases made through these links.
Tests – · 1 test Owners 69 · 1 review
Best test result: #1 of 8 in 2022 Consumer Reports All-Season Tires (tested tread life (miles))
Tests – · none yet Owners 62 · 205 reviews
“Sounds as if Aus is rationalising inventory John. Pity because the HP is a good dirt road tyre with stones around. That said the XM2 is also a tough tyre & designed to take knocks that would damage High Performance summer tyres.”
Relative Score per category, 0–100. Open “Why this score” for the tests and owner ratings behind it.
| Source | Defender T+H | Primacy HP |
|---|---|---|
| Professional tests (TWG score) | ≈ 69 (est.) | ≈ 66 (est.) |
| Reviews found online | 70 | 62 |
Defender T+H: 60% × 68.9 (est.) + 40% × 70.1 = 69
Primacy HP: 60% × 65.7 (est.) + 40% × 62.4 = 64
No road tests of dry for Defender T+H. The test half is estimated from the owner ratings, as far as owners and testers agree (correlation 0.42).
No road tests of dry for Primacy HP. The test half is estimated from the owner ratings, as far as owners and testers agree (correlation 0.42).
| Source | Defender T+H | Primacy HP |
|---|---|---|
| Professional tests (TWG score) | ≈ 72 (est.) | ≈ 67 (est.) |
| Reviews found online | 73 | 63 |
Defender T+H: 60% × 71.9 (est.) + 40% × 72.8 = 72
Primacy HP: 60% × 66.6 (est.) + 40% × 63.1 = 65
No road tests of wet for Defender T+H. The test half is estimated from the owner ratings, as far as owners and testers agree (correlation 0.55).
No road tests of wet for Primacy HP. The test half is estimated from the owner ratings, as far as owners and testers agree (correlation 0.55).
| Source | Defender T+H | Primacy HP |
|---|---|---|
| Professional tests (TWG score) | ≈ 68 (est.) | – |
| Reviews found online | 61 | – |
Defender T+H: 60% × 67.6 (est.) + 40% × 61.2 = 65
No road tests of snow for Defender T+H. The test half is estimated from the owner ratings, as far as owners and testers agree (correlation 0.32).
| Source | Defender T+H | Primacy HP |
|---|---|---|
| Professional tests (TWG score) | ≈ 68 (est.) | ≈ 66 (est.) |
| Reviews found online | 66 | 58 |
Defender T+H: 40% × 68.2 (est.) + 60% × 66 = 67
Primacy HP: 40% × 66.5 (est.) + 60% × 57.6 = 61
No road tests of comfort for Defender T+H. The test half is estimated from the owner ratings, as far as owners and testers agree (correlation 0.20).
No road tests of comfort for Primacy HP. The test half is estimated from the owner ratings, as far as owners and testers agree (correlation 0.20).
| Source | Defender T+H | Primacy HP |
|---|---|---|
| Professional tests (TWG score) · 1 / – tests | 76 | ≈ 65 (est.) |
| Reviews found online | 68 | 61 |
Defender T+H: 60% × 76.1 + 40% × 67.9 = 73
Primacy HP: 60% × 64.6 (est.) + 40% × 61.1 = 63
No road tests of treadwear for Primacy HP. The test half is estimated from the owner ratings, as far as owners and testers agree (correlation 0.36).
| Source | Defender T+H | Primacy HP |
|---|---|---|
| Reviews found online | – | 59 |
| Category | Michelin Defender T+H | Michelin Primacy HP |
|---|---|---|
| Relative Score | 71 | 64 |
| Dry | 69 | 64 |
| Wet | 72 | 65 |
| Snow | 65 | – |
| Comfort | 67 | 61 |
| Treadwear | 73 | 63 |
| Handling (owners) | – | 59 |
Higher is better. The Relative Score follows your weights below; category scores do not change.
Wet grip starts at “Important”. Treadwear starts at “Neutral” here: road tests measured it for at most one of the two tires, so it rests on owner reviews. Move the sliders and the scores update instantly.
Only one of the two tires has a score here, so this weight changes nothing in the head-to-head.
Only one of the two tires has a score here, so this weight changes nothing in the head-to-head.
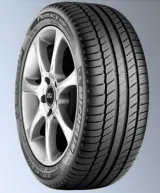
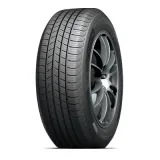
Defender T+H
Primacy HP
Only categories both tires have data for count toward the headline score.
Per discipline: the average % of the best tire over every test both tires were in, and how many of those tests each one won. “Different tests” rows compare results from separate tests.
| Discipline | Category | Defender T+H | Primacy HP | Δ | Head-to-head |
|---|---|---|---|---|---|
| Also published by the testers (not in the score) | |||||
| Overall Ranking | Overall | #1/8 2022 Consumer Reports All-Season Tires | #5/6 2010 Autocar Tyre Test - FWD | – | Different tests |
Themes extracted from owner reviews found online — not the opinion of TireWheelGuide.
Not enough owner reviews yet to extract themes.
From Reddit, forums and review threads. Not part of our score
We haven't collected enough community discussion about this tire yet.
Community opinion on the Michelin Primacy HP is divided depending on use case: enthusiasts frequently criticize them for lacking grip compared to dedicated Pilot Sport performance tires, though many appreciate their playful, low-traction slide characteristics on cars like the GR86/BRZ. Owners also note their low rolling resistance and suitability for mild climates, but raise occasional discussions around shoulder cracking with age and their limitation as summer-only rubber.
“You will notice the difference, but if you don't track, autocross, or canyon carve, I wouldn't bother. You don't have to stick with Primacy but it's not worth the PSS. The only reason I would go PSS in that instance, is if the price is similar to Primacy HP (it might actually be similar). If you drive in snow at all I would not go with PSS. Do not go with anything more aggressive than PSS for day to day street driving. There are people who daily drive more aggressive RS3s, RE-71s, ZII Star Specs, etc. but they track/autocross, know the limits, and take it easy around standing water.”
“I noticed these cracks at around spring this year. The car experiences frequent moments of hard driving so I'm thinking of replacing the tires next spring when the car comes out of hibernation as I'm a little worried about how they're going to hold up despite there still being plenty of thread left. The tires are original to the car (2016 Scion FRS). Date code of this one is 4215, but they're all within a couple of weeks or so and they're all in the same condition. Tires and car have 25,000km on them.”
“So long as you’ve got some tread, the stock Primacy HP tires are plenty safe for Bay Area weather all year ‘round. Just don’t drive anywhere that gets real winter weather or freezing temps. I’d avoid trips up to Tahoe in January. And don’t climb Mt. Diablo or Mt. Hamilton when they get their occasional dusting of snow. (I live in upstate NY now, so I’m familiar with tires & winter conditions …but I’m also a Bay Area native.)”
Based on 36 community posts
| Attribute | A · Michelin Defender T+H | B · Michelin Primacy HP |
|---|---|---|
| Category | All Season | Summer |
| Vehicle type | SUV and 4x4 | Passenger Car / Crossover |
| UTQG | 820 A - B B | 240 A A |
Michelin Defender T+H
Michelin Primacy HP
Winner: Michelin Defender T+H — better treadwear, wet and comfort. It leads or ties in every category we score. Michelin Defender T+H rests on little evidence so far (1 test, 1 review), so read this result as provisional.
Michelin Defender T+H scores 73 vs 63 on treadwear.
Michelin Defender T+H scores 72 vs 65 on wet.
Michelin Defender T+H scores 67 vs 61 on comfort.
Michelin Defender T+H scores 69 vs 64 on dry.
TireWheelGuide may earn a commission from purchases made through these links.
Michelin Defender T+H, 72 vs 65 on our wet score.
Michelin Defender T+H, 69 vs 64 on our dry score.
Michelin Defender T+H, 67 vs 61 on our comfort score.
Michelin Defender T+H, 73 vs 63 on our treadwear score.
Every category score blends two independent signals. 60% comes from professional tire tests (braking distances, lap times, noise measurements), each result compared with every other tire in the same test and newer tests counting more. 40% comes from owner reviews found online, adjusted for how generously each site rates. Both use one scale: the average tested tire gets 70, the best 100. When a tire has only one of the two, the missing half is estimated from the other and the score stays closer to average; with no road test and fewer than five owner reviews it gets no score yet.
Handling is the exception: road tests measure it inside the dry and wet scores, so its own row comes from owner ratings only and starts as less important.
Community buzz from Reddit and forums is shown for context only — it never changes the score. Full methodology