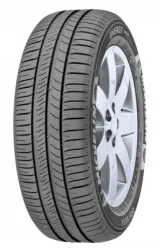
Tests – · none yet Owners 75 · 66 reviews
Head-to-head
Updated
Michelin Energy Saver+ vs Michelin Energy XM2 — Compared
Relative Score (0–100): the weighted average of the categories below, each 60% road tests and 40% owner reviews (comfort 40/60). Based on 0 + 0 road tests and 66 + 57 owner reviews. How we score
Energy Saver+ leads, 72–68 Narrow edge
Add your size for an exact match
/R
Both Amazon links then search this exact size.
TireWheelGuide may earn a commission from purchases made through these links.
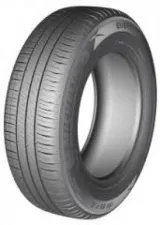
Tests – · none yet Owners 69 · 57 reviews
Category by category
Relative Score per category, 0–100. Open “Why this score” for the tests and owner ratings behind it.
-
71
Dry
Energy Saver+ +566Why this score
Source Energy Saver+ Energy XM2 Professional tests (TWG score) ≈ 70 (est.) ≈ 67 (est.) Reviews found online 73 65 Energy Saver+: 60% × 70 (est.) + 40% × 72.9 = 71
Energy XM2: 60% × 66.7 (est.) + 40% × 64.9 = 66
No road tests of dry for Energy Saver+. The test half is estimated from the owner ratings, as far as owners and testers agree (correlation 0.41).
No road tests of dry for Energy XM2. The test half is estimated from the owner ratings, as far as owners and testers agree (correlation 0.41).
-
71
Wet
Energy Saver+ +170Why this score
Source Energy Saver+ Energy XM2 Professional tests (TWG score) ≈ 71 (est.) ≈ 70 (est.) Reviews found online 71 69 Energy Saver+: 60% × 70.9 (est.) + 40% × 71 = 71
Energy XM2: 60% × 69.9 (est.) + 40% × 69.1 = 70
No road tests of wet for Energy Saver+. The test half is estimated from the owner ratings, as far as owners and testers agree (correlation 0.55).
No road tests of wet for Energy XM2. The test half is estimated from the owner ratings, as far as owners and testers agree (correlation 0.55).
-
72
Comfort
Energy Saver+ +864Why this score
Source Energy Saver+ Energy XM2 Professional tests (TWG score) ≈ 70 (est.) ≈ 67 (est.) Reviews found online 74 62 Energy Saver+: 40% × 69.8 (est.) + 60% × 73.7 = 72
Energy XM2: 40% × 67.4 (est.) + 60% × 62.2 = 64
No road tests of comfort for Energy Saver+. The test half is estimated from the owner ratings, as far as owners and testers agree (correlation 0.20).
No road tests of comfort for Energy XM2. The test half is estimated from the owner ratings, as far as owners and testers agree (correlation 0.20).
-
77
Treadwear
Energy Saver+ +572Why this score
Source Energy Saver+ Energy XM2 Professional tests (TWG score) ≈ 73 (est.) ≈ 69 (est.) Reviews found online 84 75 Energy Saver+: 60% × 72.8 (est.) + 40% × 83.9 = 77
Energy XM2: 60% × 69.5 (est.) + 40% × 74.8 = 72
No road tests of treadwear for Energy Saver+. The test half is estimated from the owner ratings, as far as owners and testers agree (correlation 0.36).
No road tests of treadwear for Energy XM2. The test half is estimated from the owner ratings, as far as owners and testers agree (correlation 0.36).
-
72
Handling (owners)
Energy Saver+ +666Why this score
Source Energy Saver+ Energy XM2 Reviews found online 72 66
Scores at a glance
| Category | Michelin Energy Saver+ | Michelin Energy XM2 |
|---|---|---|
| Relative Score | 72 | 68 |
| Dry | 71 | 66 |
| Wet | 71 | 70 |
| Comfort | 72 | 64 |
| Treadwear | 77 | 72 |
| Handling (owners) | 72 | 66 |
Higher is better. The Relative Score follows your weights below; category scores do not change.
Weight the categories that matter to you
Wet grip starts at “Important”. Treadwear starts at “Neutral” here: road tests measured it for at most one of the two tires, so it rests on owner reviews. Move the sliders and the scores update instantly.
Important
NotLessNeutralImportantMost
Important
NotLessNeutralImportantMost
Less important
NotLessNeutralImportantMost
Neutral
NotLessNeutralImportantMost
Less important
NotLessNeutralImportantMost
Recomputed
Headline score
72
/ 100
Energy Saver+
68
/ 100
Energy XM2
Pros, cons & observations
Themes extracted from owner reviews found online — not the opinion of TireWheelGuide.
Tire A Energy Saver+
Pros
- Exceptional tread life: many owners report 40,000 to 100,000+ km, with some exceeding 120,000 km, and a few vehicles with very little wear after 40,000 miles
- Strong dry grip and dry braking, with several reviewers describing it as excellent or phenomenal and stable at high speeds
- Comfortable and quiet ride on motorways and rough roads, with several reviewers praising low noise
Cons
- Wet-weather weaknesses are the most common complaint: reduced braking and cornering grip, aquaplaning and an unpredictable feel when pushed
- Unsuited to spirited driving: the tyre slips easily under hard cornering, has soft sidewalls and feels bumpy in turns, and some owners report grip fading late in its life
- Ageing issues reported by several owners, including sidewall or shoulder cracking and dry rotting at around 4 to 5 years
Tire B Energy XM2
Pros
- Exceptional tread longevity and durability
- Strong puncture resistance
- Reliable dry and wet grip for daily driving
Cons
- Increased road noise as the tire wears
- Soft sidewalls can feel less responsive during spirited driving
- Premium price point compared to competitors
Specs side by side
| Attribute | A · Michelin Energy Saver+ | B · Michelin Energy XM2 |
|---|---|---|
| Category | Summer | Summer |
| Vehicle type | Passenger Car / Crossover | Passenger Car / Crossover |
| Sizes available | 24 | 3 |
| Rim diameters | 14″ – 16″ | 15″ – 16″ |
| Sizes in common | 3 | 3 |
Which one should you actually buy?
72
/ 100
Michelin Energy Saver+
68
/ 100
Michelin Energy XM2
Narrow edge: Michelin Energy Saver+ — better comfort, handling and dry. It leads or ties in every category we score.
Pick tire A
You want the most comfortable ride
Michelin Energy Saver+ scores 72 vs 64 on comfort.
Pick tire A
You enjoy sharp, responsive handling
Michelin Energy Saver+ scores 72 vs 66 on handling.
Pick tire A
You want the most grip on dry roads
Michelin Energy Saver+ scores 71 vs 66 on dry.
Pick tire A
You want the longest tread life
Michelin Energy Saver+ scores 77 vs 72 on treadwear.
Tire A · Michelin Energy Saver+
Tire B · Michelin Energy XM2
TireWheelGuide may earn a commission from purchases made through these links.
Energy Saver+ or Energy XM2?
Which is better in the wet, Energy Saver+ or Energy XM2?
Neither, by our numbers: 71 vs 70 on the wet score, within 3 points.
Which grips better on dry roads, Energy Saver+ or Energy XM2?
Michelin Energy Saver+, 71 vs 66 on our dry score.
Which is more comfortable, Energy Saver+ or Energy XM2?
Michelin Energy Saver+, 72 vs 64 on our comfort score.
Which lasts longer, Energy Saver+ or Energy XM2?
Michelin Energy Saver+, 77 vs 72 on our treadwear score.
How do we compare tires?
Every category score blends two independent signals. 60% comes from professional tire tests (braking distances, lap times, noise measurements), each result compared with every other tire in the same test and newer tests counting more. 40% comes from owner reviews found online, adjusted for how generously each site rates. Both use one scale: the average tested tire gets 70, the best 100. When a tire has only one of the two, the missing half is estimated from the other and the score stays closer to average; with no road test and fewer than five owner reviews it gets no score yet.
Handling is the exception: road tests measure it inside the dry and wet scores, so its own row comes from owner ratings only and starts as less important.
Community buzz from Reddit and forums is shown for context only — it never changes the score. Full methodology