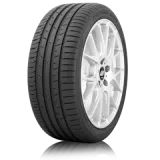
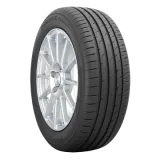
Toyo Proxes Sport vs Toyo Proxes Comfort — Compared
Relative Score (0–100): the weighted average of the categories below, each 60% road tests and 40% owner reviews (comfort 40/60). Based on 20 + 15 road tests and 1,277 + 631 owner reviews. How we score
No owner ratings of noise for Proxes Comfort. The owner half is the owners’ average (67): owners’ noise ratings barely follow the road tests, so the tests say nothing about how owners would rate it.
44
Treadwear
Proxes Comfort +28
72
Why this score
Source
Proxes Sport
Proxes Comfort
Professional tests (TWG score) · 5 / 5 tests
37
68
Reviews found online
55
78
Proxes Sport:60% × 37.3 + 40% × 54.6 = 44
Proxes Comfort:60% × 68 + 40% × 77.6 = 72
55
Handling (owners)
Proxes Comfort +22
77
Why this score
Source
Proxes Sport
Proxes Comfort
Reviews found online
55
77
41
Efficiency
Proxes Comfort +19
60
Why this score
Source
Proxes Sport
Proxes Comfort
Professional tests (TWG score) · 12 / 10 tests
41
60
Scores at a glance
Toyo Proxes Sport vs Toyo Proxes Comfort: scores by category (0–100)
Category
Toyo Proxes Sport
Toyo Proxes Comfort
Relative Score
59
77
Dry
62
83
Wet
70
81
Snow
35
–
Comfort
55
70
Noise
71
71
Treadwear
44
72
Handling (owners)
55
77
Efficiency
41
60
Higher is better. The Relative Score follows your weights below; category scores do not change.
Weight the categories that matter to you
Wet grip and treadwear start at “Important” — the two things buyers rank highest. Move the sliders and the scores update instantly.
Important
NotLessNeutralImportantMost
Important
NotLessNeutralImportantMost
Neutral
NotLessNeutralImportantMost
Only one of the two tires has a score here, so this weight changes nothing in the head-to-head.
Less important
NotLessNeutralImportantMost
Less important
NotLessNeutralImportantMost
Important
NotLessNeutralImportantMost
Less important
NotLessNeutralImportantMost
Not important
NotLessNeutralImportantMost
Recomputed
Headline score
59
/ 100
± 6
Proxes Sport
77
/ 100
± 6
Proxes Comfort
Only categories both tires have data for count toward the headline score.
The professional test results behind the scores
Per discipline: the average % of the best tire over every test both tires were in, and how many of those tests each one won. “Different tests” rows compare results from separate tests.
Discipline
Category
Proxes Sport
Proxes Comfort
Δ
Head-to-head
Dry Braking
Dry
92%#7/8 · 2021 Sport Auto UHP Summer Tyre Test
96%#6/52 · 2025 Summer Tyre Test Shootout
–
Different tests
Dry Handling
Dry
98%#7/8 · 2021 Sport Auto UHP Summer Tyre Test
98%#10/20 · 2025 Auto Bild Summer Performance Tyre Test
–
Different tests
Straight Aquaplaning
Wet
98%#3/8 · 2021 Sport Auto UHP Summer Tyre Test
98%#13/20 · 2025 Auto Bild Summer Performance Tyre Test
–
Different tests
Wet Braking
Wet
82%#8/8 · 2021 Sport Auto UHP Summer Tyre Test
90%#13/52 · 2025 Summer Tyre Test Shootout
–
Different tests
Wet Circle
Wet
91%#8/8 · 2021 Sport Auto UHP Summer Tyre Test
97%#12/20 · 2025 Auto Bild Summer Performance Tyre Test
–
Different tests
Wet Handling
Wet
94%#8/8 · 2021 Sport Auto UHP Summer Tyre Test
97%#13/20 · 2025 Auto Bild Summer Performance Tyre Test
–
Different tests
Comfort (tester's mark)
Comfort
60%#10/11 · 2020 AMS 18 Inch Summer Tyre Test
86%#13/20 · 2025 Auto Bild Summer Performance Tyre Test
–
Different tests
Noise
Noise
98%#6/8 · 2021 Sport Auto UHP Summer Tyre Test
98%#5/20 · 2025 Auto Bild Summer Performance Tyre Test
–
Different tests
Wear
Treadwear
84%#13/16 · 2020 ADAC 18 Inch Summer Tyre Test
71%#8/20 · 2025 Auto Bild Summer Performance Tyre Test
–
Different tests
Rolling Resistance
Efficiency
86%#7/8 · 2021 Sport Auto UHP Summer Tyre Test
89%#4/20 · 2025 Auto Bild Summer Performance Tyre Test
–
Different tests
Also published by the testers (not in the score)
Price
Cost
72%#4/8 · 2021 Sport Auto UHP Summer Tyre Test
70%#4/12 · 2023 Best SUV Tyres Tested
–
Different tests
Total Cost of Ownership
Cost
#17/202020 Auto Bild Summer Tyre Test
#3/202025 Auto Bild Summer Performance Tyre Test
–
Different tests
Value
Cost
60%#17/20 · 2020 Auto Bild Summer Tyre Test
83%#3/20 · 2025 Auto Bild Summer Performance Tyre Test
–
Different tests
Grass Traction
Off-road
89%#8/10 · 2019 SUV 4x4 Summer Tyre Test
89%#3/12 · 2023 Best SUV Tyres Tested
–
Different tests
Gravel Handling
Off-road
100%#2/10 · 2019 SUV 4x4 Summer Tyre Test
99%#8/10 · 2022 AutoBild SUV 4x4 Summer Tyre Test
–
Different tests
Gravel Traction
Off-road
93%#5/10 · 2019 SUV 4x4 Summer Tyre Test
87%#8/10 · 2022 AutoBild SUV 4x4 Summer Tyre Test
–
Different tests
Mud Traction
Off-road
88%#8/10 · 2019 SUV 4x4 Summer Tyre Test
77%#11/12 · 2023 Best SUV Tyres Tested
–
Different tests
Overall Ranking
Overall
#15/222022 Consumer Reports Ultra High Performance Summer Tires
#11/522025 Summer Tyre Test Shootout
–
Different tests
Pros, cons & observations
Themes extracted from owner reviews found online — not the opinion of TireWheelGuide.
Tire A Proxes Sport
Pros
Significantly more affordable than premium tier summer tires while offering around 80-90% of the performance
Commendable grip and handling in dry conditions with a progressive, predictable breakaway
Low road noise and generally high ride comfort compared to factory run-flats or older performance tires
Cons
Faster-than-expected tread wear, with multiple users reporting replacement necessary between 6,000 and 12,000 miles
Inconsistent or slippery wet-weather traction and occasional tendency to hydroplane in heavy standing water
Stiff sidewalls on certain sizes leading to a harsher ride quality or increased noise for some drivers
From Reddit, forums and review threads. Not part of our score
Tire A
Toyo Proxes Sport
Positive
Community sentiment toward the Toyo Proxes Sport family is generally positive, with drivers praising its ride comfort, good value for money, and competent daily street grip. Many owners appreciate unique size options like 345/25-20 for high-performance cars, though enthusiasts note that dedicated track tires offer superior turn-in sharpness and ultimate traction. A common topic of discussion is the scarcity of extensive real-world reviews, particularly regarding newer variants.
Every category score blends two independent signals. 60% comes from professional tire tests (braking distances, lap times, noise measurements), each result compared with every other tire in the same test and newer tests counting more. 40% comes from owner reviews found online, adjusted for how generously each site rates. Both use one scale: the average tested tire gets 70, the best 100. When a tire has only one of the two, the missing half is estimated from the other and the score stays closer to average; with no road test and fewer than five owner reviews it gets no score yet.
Handling is the exception: road tests measure it inside the dry and wet scores, so its own row comes from owner ratings only and starts as less important.
Community buzz from Reddit and forums is shown for context only — it never changes the score. Full methodology