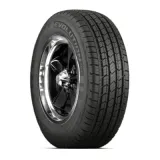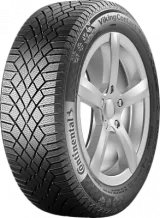
Tests 75 · 8 tests Owners 62 · 33 reviews
Best test result: #1 of 20 in 2020 Nordic and Studded Winter Tyre Test (snow braking)
Relative Score (0–100): the weighted average of the categories below, each 60% road tests and 40% owner reviews (comfort 40/60). Based on 8 + 0 road tests and 33 + 674 owner reviews. How we score
Too close to call: VikingContact 7 and Evolution Tour are level at 68.
Both Amazon links then search this exact size.
TireWheelGuide may earn a commission from purchases made through these links.
Tests 75 · 8 tests Owners 62 · 33 reviews
Best test result: #1 of 20 in 2020 Nordic and Studded Winter Tyre Test (snow braking)
Tests – · none yet Owners 68 · 674 reviews
“I have Cooper Evolution Tours on my Equinox. No major complaints, but would probably move up to the Discoverer line in the future. The Evolution Tours ride nice and are very quiet, but there is no way they will go 65,000 miles as indicated by Cooper. I have just about 17,000 miles on them, and they are already down to 6/32 on all four despite rotating them every 5,000-7,000 miles. Next time I get tires I want to try one of the new "severe weather rated" tires. Considering either the Cooper Discoverer Enduramax or Falken Wildpeak A/T Trail.”
Relative Score per category, 0–100. Open “Why this score” for the tests and owner ratings behind it.
| Source | VikingContact 7 | Evolution Tour |
|---|---|---|
| Professional tests (TWG score) · 8 / – tests | 77 | ≈ 68 (est.) |
| Reviews found online | 51 | 69 |
VikingContact 7: 60% × 76.6 + 40% × 50.7 = 66
Evolution Tour: 60% × 68.4 (est.) + 40% × 69.1 = 69
No road tests of dry for Evolution Tour. The test half is estimated from the owner ratings, as far as owners and testers agree (correlation 0.41).
| Source | VikingContact 7 | Evolution Tour |
|---|---|---|
| Professional tests (TWG score) · 8 / – tests | 69 | ≈ 72 (est.) |
| Reviews found online | 66 | 72 |
VikingContact 7: 60% × 68.7 + 40% × 65.7 = 68
Evolution Tour: 60% × 71.5 (est.) + 40% × 72.2 = 72
No road tests of wet for Evolution Tour. The test half is estimated from the owner ratings, as far as owners and testers agree (correlation 0.55).
| Source | VikingContact 7 | Evolution Tour |
|---|---|---|
| Professional tests (TWG score) · 8 / – tests | 79 | ≈ 64 (est.) |
| Reviews found online | 72 | 49 |
VikingContact 7: 60% × 79 + 40% × 72.1 = 76
Evolution Tour: 60% × 63.8 (est.) + 40% × 49.3 = 58
No road tests of snow for Evolution Tour. The test half is estimated from the owner ratings, as far as owners and testers agree (correlation 0.32).
| Source | VikingContact 7 | Evolution Tour |
|---|---|---|
| Professional tests (TWG score) · 1 / – tests | 70 | ≈ 68 (est.) |
| Reviews found online | 71 | 67 |
VikingContact 7: 40% × 70 + 60% × 70.6 = 70
Evolution Tour: 40% × 68.4 (est.) + 60% × 67.2 = 68
No road tests of comfort for Evolution Tour. The test half is estimated from the owner ratings, as far as owners and testers agree (correlation 0.20).
| Source | VikingContact 7 | Evolution Tour |
|---|---|---|
| Professional tests (TWG score) · 6 / – tests | 88 | ≈ 66 (est.) |
| Reviews found online | 68 | 70 |
VikingContact 7: 60% × 87.6 + 40% × 68.4 = 80
Evolution Tour: 60% × 66.4 (est.) + 40% × 70.1 = 68
No road tests of noise for Evolution Tour. The test half is the tested tires’ average (66): owners’ noise ratings barely follow the road tests.
| Source | VikingContact 7 | Evolution Tour |
|---|---|---|
| Professional tests (TWG score) | ≈ 63 (est.) | ≈ 69 (est.) |
| Reviews found online | 56 | 72 |
VikingContact 7: 60% × 62.6 (est.) + 40% × 55.8 = 60
Evolution Tour: 60% × 68.5 (est.) + 40% × 72 = 70
No road tests of treadwear for VikingContact 7. The test half is estimated from the owner ratings, as far as owners and testers agree (correlation 0.36).
No road tests of treadwear for Evolution Tour. The test half is estimated from the owner ratings, as far as owners and testers agree (correlation 0.36).
| Source | VikingContact 7 | Evolution Tour |
|---|---|---|
| Reviews found online | 64 | 68 |
| Source | VikingContact 7 | Evolution Tour |
|---|---|---|
| Professional tests (TWG score) · 4 / – tests | 77 | – |
| Category | Continental VikingContact 7 | Cooper Evolution Tour |
|---|---|---|
| Relative Score | 68 | 68 |
| Dry | 66 | 69 |
| Wet | 68 | 72 |
| Snow | 76 | 58 |
| Comfort | 70 | 68 |
| Noise | 80 | 68 |
| Treadwear | 60 | 70 |
| Handling (owners) | 64 | 68 |
| Efficiency | 77 | – |
Higher is better. The Relative Score follows your weights below; category scores do not change.
Wet grip starts at “Important”. Treadwear starts at “Neutral” here: road tests measured it for at most one of the two tires, so it rests on owner reviews. Move the sliders and the scores update instantly.
Only one of the two tires has a score here, so this weight changes nothing in the head-to-head.
VikingContact 7
Evolution Tour
Only categories both tires have data for count toward the headline score.
Themes extracted from owner reviews found online — not the opinion of TireWheelGuide.
From Reddit, forums and review threads. Not part of our score
We haven't collected enough community discussion about this tire yet.
Community members report that the Cooper Evolution Tour offers a smooth, quiet ride and decent performance that often surpasses certain OEM tires. However, multiple users express disappointment regarding treadwear, noting that the tires wear down significantly faster than their advertised 65,000-mile warranty suggests.
“No one recommending Cooper tires? Hey everyone!! My very first car is a 2019 honda fit EX and I'm new to pretty much everything in regards to it. I've had it since May of last year. I don't see any recommendations for Cooper tires. Is there a reason for this? I'm looking into the Cooper Evolution Tour All Season. My dad (who used to be a mechanic) suggests them, and they're available at the closest Walmart. I'm also looking into Yokohama, but they'll have to be shipped and they're 20$ more per tire. I'll most likely replace all four. I'm at 32k miles, but my rear passenger tire blew out the other day. The car still has the stock tires. Read more”
“It appears the Endeavor might be one step above the Evolution based on the Cooper website and their performance chart that compares tires to other Cooper tires. I like the performance characteristics of my Cooper Evolution Tour tires, I just wish the tread wear was a little better, especially for a 65,000 mile rated tire. I am down to 5/32 tread depth on all four tires after only 20,000 miles.”
Based on 6 community posts
| Attribute | A · Continental VikingContact 7 | B · Cooper Evolution Tour |
|---|---|---|
| Category | Winter | All-Season tire |
| Vehicle type | Passenger Car / Crossover | Passenger Car / Crossover |
| Sizes available | 134 | — |
| Rim diameters | 14″ – 22″ | — |
| Tread depth | 10 - 11/32″ | 10/32″ |
| UTQG | — | 580 - 600 A A - B |
| Sidewall | Black Side Wall | Black Side Wall |
| Max pressure | 44 - 51 psi | 44 psi |
Continental VikingContact 7
Cooper Evolution Tour
Too close to call: Continental VikingContact 7 and Cooper Evolution Tour are within 2 points overall. Continental VikingContact 7 is stronger on snow and noise. Cooper Evolution Tour is stronger on treadwear, wet and dry.
Continental VikingContact 7 scores 76 vs 58 on snow.
Continental VikingContact 7 scores 80 vs 68 on noise.
Cooper Evolution Tour scores 70 vs 60 on treadwear.
Cooper Evolution Tour scores 72 vs 68 on wet.
TireWheelGuide may earn a commission from purchases made through these links.
Cooper Evolution Tour, 72 vs 68 on our wet score.
Cooper Evolution Tour, 69 vs 66 on our dry score.
Continental VikingContact 7, 76 vs 58 on our snow score.
Continental VikingContact 7, 80 vs 68 on our noise score.
Neither, by our numbers: 70 vs 68 on the comfort score, within 3 points.
Cooper Evolution Tour, 70 vs 60 on our treadwear score.
Every category score blends two independent signals. 60% comes from professional tire tests (braking distances, lap times, noise measurements), each result compared with every other tire in the same test and newer tests counting more. 40% comes from owner reviews found online, adjusted for how generously each site rates. Both use one scale: the average tested tire gets 70, the best 100. When a tire has only one of the two, the missing half is estimated from the other and the score stays closer to average; with no road test and fewer than five owner reviews it gets no score yet.
Handling is the exception: road tests measure it inside the dry and wet scores, so its own row comes from owner ratings only and starts as less important.
Community buzz from Reddit and forums is shown for context only — it never changes the score. Full methodology