Tests – · 1 test Owners 73 · 9 reviews
Best test result: #5 of 18 in 2022 Consumer Reports All Terrain Truck Tires (tested tread life (miles))
Hankook Dynapro AS RH03 is discontinued — replaced by Hankook Dynapro HT RH12. Compare Dynapro HT RH12 with Destination A/T2
Relative Score (0–100): the weighted average of the categories below, each 60% road tests and 40% owner reviews. Based on 1 + 0 road tests and 9 + 3 owner reviews. How we score
Destination A/T2 is ahead, 72–57
Both Amazon links then search this exact size.
TireWheelGuide may earn a commission from purchases made through these links.
Tests – · 1 test Owners 73 · 9 reviews
Best test result: #5 of 18 in 2022 Consumer Reports All Terrain Truck Tires (tested tread life (miles))
Tests – · none yet Owners 51 · 3 reviews
Relative Score per category, 0–100. Open “Why this score” for the tests and owner ratings behind it.
| Source | Destination A/T2 | Dynapro AS RH03 |
|---|---|---|
| Professional tests (TWG score) | ≈ 69 (est.) | ≈ 60 (est.) |
| Reviews found online | 71 | 49 |
Destination A/T2: 60% × 69.2 (est.) + 40% × 71.3 = 70
Dynapro AS RH03: 60% × 60.2 (est.) + 40% × 49 = 56
No road tests of dry for Destination A/T2. The test half is estimated from the owner ratings, as far as owners and testers agree (correlation 0.40).
No road tests of dry for Dynapro AS RH03. The test half is estimated from the owner ratings, as far as owners and testers agree (correlation 0.40).
| Source | Destination A/T2 | Dynapro AS RH03 |
|---|---|---|
| Professional tests (TWG score) | ≈ 74 (est.) | ≈ 60 (est.) |
| Reviews found online | 78 | 53 |
Destination A/T2: 60% × 74.4 (est.) + 40% × 78 = 76
Dynapro AS RH03: 60% × 60.3 (est.) + 40% × 52.8 = 57
No road tests of wet for Destination A/T2. The test half is estimated from the owner ratings, as far as owners and testers agree (correlation 0.56).
No road tests of wet for Dynapro AS RH03. The test half is estimated from the owner ratings, as far as owners and testers agree (correlation 0.56).
| Source | Destination A/T2 | Dynapro AS RH03 |
|---|---|---|
| Professional tests (TWG score) | ≈ 71 (est.) | ≈ 62 (est.) |
| Reviews found online | 73 | 45 |
Destination A/T2: 60% × 71 (est.) + 40% × 73.4 = 72
Dynapro AS RH03: 60% × 61.6 (est.) + 40% × 44.8 = 55
No road tests of snow for Destination A/T2. The test half is estimated from the owner ratings, as far as owners and testers agree (correlation 0.33).
No road tests of snow for Dynapro AS RH03. The test half is estimated from the owner ratings, as far as owners and testers agree (correlation 0.33).
| Source | Destination A/T2 | Dynapro AS RH03 |
|---|---|---|
| Professional tests (TWG score) | ≈ 70 (est.) | ≈ 66 (est.) |
| Reviews found online | 75 | 48 |
Destination A/T2: 60% × 70.1 (est.) + 40% × 74.7 = 72
Dynapro AS RH03: 60% × 65.5 (est.) + 40% × 48.3 = 59
No road tests of comfort for Destination A/T2 or Dynapro AS RH03. The test half is the tested tires’ average (69): owners’ comfort ratings barely follow the road tests.
| Source | Destination A/T2 | Dynapro AS RH03 |
|---|---|---|
| Professional tests (TWG score) | ≈ 67 (est.) | ≈ 67 (est.) |
| Reviews found online | 76 | 51 |
Destination A/T2: 60% × 67.3 (est.) + 40% × 75.7 = 71
Dynapro AS RH03: 60% × 67.3 (est.) + 40% × 50.7 = 61
No road tests of noise for Destination A/T2 or Dynapro AS RH03. The test half is the tested tires’ average (67): owners’ noise ratings barely follow the road tests.
| Source | Destination A/T2 | Dynapro AS RH03 |
|---|---|---|
| Professional tests (TWG score) · 1 / – tests | 71 | ≈ 63 (est.) |
| Reviews found online | 69 | 56 |
Destination A/T2: 60% × 70.9 + 40% × 69.2 = 70
Dynapro AS RH03: 60% × 62.8 (est.) + 40% × 56.3 = 60
No road tests of treadwear for Dynapro AS RH03. The test half is estimated from the owner ratings, as far as owners and testers agree (correlation 0.31).
| Source | Destination A/T2 | Dynapro AS RH03 |
|---|---|---|
| Reviews found online | 73 | 49 |
| Category | Firestone Destination A/T2 | Hankook Dynapro AS RH03 |
|---|---|---|
| Relative Score | 72 | 57 |
| Dry | 70 | 56 |
| Wet | 76 | 57 |
| Snow | 72 | 55 |
| Comfort | 72 | 59 |
| Noise | 71 | 61 |
| Treadwear | 70 | 60 |
| Handling (owners) | 73 | 49 |
Higher is better. The Relative Score follows your weights below; category scores do not change.
Wet grip starts at “Important”. Treadwear starts at “Neutral” here: road tests measured it for at most one of the two tires, so it rests on owner reviews. Move the sliders and the scores update instantly.
Destination A/T2
Dynapro AS RH03
Themes extracted from owner reviews found online — not the opinion of TireWheelGuide.
Not enough owner reviews yet to extract themes.
| Attribute | A · Firestone Destination A/T2 | B · Hankook Dynapro AS RH03 |
|---|---|---|
| Category | All-Terrain tire | All-Season tire |
| Vehicle type | SUV and 4x4 | SUV and 4x4 |
| Sizes available | 33 | — |
| Rim diameters | 15″ – 22″ | — |
| Tread depth | 10 - 12/32″ | 14/32″ |
| UTQG | 540 - 560 A B | — |
| Treadwear warranty | 55,000 mi | — |
| Sidewall | Black Side Wall - Raised Outline White Lettering | Blackwall |
| Max pressure | 44 - 50 psi | 80 psi |
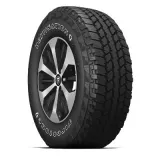
Firestone Destination A/T2
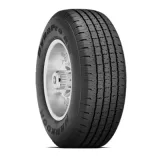
Hankook Dynapro AS RH03
Winner: Firestone Destination A/T2 — better handling, wet and snow. It leads or ties in every category we score. Firestone Destination A/T2 rests on little evidence so far (1 test, 9 reviews), so read this result as provisional. Hankook Dynapro AS RH03 rests on little evidence so far (0 tests, 3 reviews), so read this result as provisional.
Firestone Destination A/T2 scores 73 vs 49 on handling.
Firestone Destination A/T2 scores 76 vs 57 on wet.
Firestone Destination A/T2 scores 72 vs 55 on snow.
Firestone Destination A/T2 scores 70 vs 56 on dry.
TireWheelGuide may earn a commission from purchases made through these links.
Firestone Destination A/T2, 76 vs 57 on our wet score.
Firestone Destination A/T2, 70 vs 56 on our dry score.
Firestone Destination A/T2, 72 vs 55 on our snow score.
Firestone Destination A/T2, 71 vs 61 on our noise score.
Firestone Destination A/T2, 72 vs 59 on our comfort score.
Firestone Destination A/T2, 70 vs 60 on our treadwear score.
Every category score blends two independent signals. 60% comes from professional tire tests (braking distances, lap times, noise measurements), each result compared with every other tire in the same test and newer tests counting more. 40% comes from owner reviews found online, adjusted for how generously each site rates. Both use one scale: the average tested tire gets 70, the best 100. When a tire has only one of the two, the missing half is estimated from the other and the score stays closer to average; with no road test and fewer than five owner reviews it gets no score yet.
Handling is the exception: road tests measure it inside the dry and wet scores, so its own row comes from owner ratings only and starts as less important.
Community buzz from Reddit and forums is shown for context only — it never changes the score. Full methodology