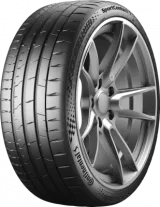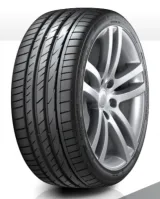
Tests 66 · 11 tests Owners 80 · 11 reviews
Best test result: #1 of 10 in 2026 Auto Zeitung 18 Inch Summer Tyre Test (noise)
Relative Score (0–100): the weighted average of the categories below, each 60% road tests and 40% owner reviews (comfort 40/60). Based on 11 + 22 road tests and 11 + 1,605 owner reviews. How we score
SportContact 7 is ahead, 83–73
Both Amazon links then search this exact size.
TireWheelGuide may earn a commission from purchases made through these links.
Tests 66 · 11 tests Owners 80 · 11 reviews
Best test result: #1 of 10 in 2026 Auto Zeitung 18 Inch Summer Tyre Test (noise)
Tests 84 · 22 tests Owners 81 · 1,605 reviews
Best test result: #1 of 18 in 2025 ADAC Summer Tyre Test (wet braking)
“On my 2nd set. Got decent mileage from them. 15k miles from the first set of rears and i've 11k on the 2nd set with 4.5mm still left on them.”
Relative Score per category, 0–100. Open “Why this score” for the tests and owner ratings behind it.
| Source | S Fit EQ+ | SportContact 7 |
|---|---|---|
| Professional tests (TWG score) · 10 / 21 tests | 80 | 100 |
| Reviews found online | 85 | 92 |
S Fit EQ+: 60% × 79.7 + 40% × 85.2 = 82
SportContact 7: 60% × 99.6 + 40% × 92 = 97
| Source | S Fit EQ+ | SportContact 7 |
|---|---|---|
| Professional tests (TWG score) · 11 / 22 tests | 74 | 96 |
| Reviews found online | 79 | 90 |
S Fit EQ+: 60% × 73.7 + 40% × 78.5 = 76
SportContact 7: 60% × 96.3 + 40% × 90 = 94
| Source | S Fit EQ+ | SportContact 7 |
|---|---|---|
| Professional tests (TWG score) · 2 / 5 tests | 66 | 56 |
| Reviews found online | 78 | 76 |
S Fit EQ+: 40% × 66 + 60% × 77.8 = 73
SportContact 7: 40% × 56.4 + 60% × 75.9 = 68
| Source | S Fit EQ+ | SportContact 7 |
|---|---|---|
| Professional tests (TWG score) · 5 / 19 tests | 77 | 59 |
| Reviews found online | ≈ 67 (est.) | ≈ 67 (est.) |
S Fit EQ+: 60% × 77.4 + 40% × 66.6 (est.) = 73
SportContact 7: 60% × 59.1 + 40% × 66.6 (est.) = 62
No owner ratings of noise for S Fit EQ+ or SportContact 7. The owner half is the owners’ average (67): owners’ noise ratings barely follow the road tests, so the tests say nothing about how owners would rate it.
| Source | S Fit EQ+ | SportContact 7 |
|---|---|---|
| Professional tests (TWG score) · 5 / 1 tests | 42 | 72 |
| Reviews found online | 76 | 61 |
S Fit EQ+: 60% × 42.1 + 40% × 76.1 = 56
SportContact 7: 60% × 72.1 + 40% × 61.3 = 68
| Source | S Fit EQ+ | SportContact 7 |
|---|---|---|
| Reviews found online | 84 | 89 |
| Source | S Fit EQ+ | SportContact 7 |
|---|---|---|
| Professional tests (TWG score) · 6 / 21 tests | 73 | 72 |
| Category | Laufenn S Fit EQ+ | Continental SportContact 7 |
|---|---|---|
| Relative Score | 73 | 83 |
| Dry | 82 | 97 |
| Wet | 76 | 94 |
| Comfort | 73 | 68 |
| Noise | 73 | 62 |
| Treadwear | 56 | 68 |
| Handling (owners) | 84 | 89 |
| Efficiency | 73 | 72 |
Higher is better. The Relative Score follows your weights below; category scores do not change.
Wet grip and treadwear start at “Important” — the two things buyers rank highest. Move the sliders and the scores update instantly.
S Fit EQ+
SportContact 7
Per discipline: the average % of the best tire over every test both tires were in, and how many of those tests each one won. “Different tests” rows compare results from separate tests.
| Discipline | Category | S Fit EQ+ | SportContact 7 | Δ | Head-to-head |
|---|---|---|---|---|---|
| Dry Braking | Dry | 93% #8/10 · 2026 Auto Zeitung 18 Inch Summer Tyre Test | 100% #1/3 · Top Tire Review 2026 UUHP Tyre Test | – | Different tests |
| Dry Handling | Dry | 98% #6/10 · 2026 Auto Zeitung 18 Inch Summer Tyre Test | 99% #2/3 · Top Tire Review 2026 UUHP Tyre Test | – | Different tests |
| Dry Handling (tester's mark) | Dry | 96% #3/10 · 2021 Motor Summer Tyre Test | 100% #1/3 · Top Tire Review 2026 UUHP Tyre Test | – | Different tests |
| Curved Aquaplaning | Wet | 77% #20/20 · 2025 Auto Bild Summer Performance Tyre Test | 87% #3/3 · Top Tire Review 2026 UUHP Tyre Test | – | Different tests |
| Straight Aquaplaning | Wet | 96% #9/10 · 2026 Auto Zeitung 18 Inch Summer Tyre Test | 98% #3/3 · Top Tire Review 2026 UUHP Tyre Test | – | Different tests |
| Wet Braking | Wet | 81% #10/10 · 2026 Auto Zeitung 18 Inch Summer Tyre Test | 100% #1/3 · Top Tire Review 2026 UUHP Tyre Test | – | Different tests |
| Wet Braking (concrete) | Wet | 90% #21/50 · 2023 ADAC Summer Tyre Test | 100% #1/18 · 2025 ADAC Summer Tyre Test | – | Different tests |
| Wet Circle | Wet | 91% #8/10 · 2026 Auto Zeitung 18 Inch Summer Tyre Test | 100% #1/3 · Top Tire Review 2026 UUHP Tyre Test | – | Different tests |
| Wet Handling | Wet | 94% #9/10 · 2026 Auto Zeitung 18 Inch Summer Tyre Test | 100% #1/3 · Top Tire Review 2026 UUHP Tyre Test | – | Different tests |
| Comfort (tester's mark) | Comfort | 50% #7/10 · 2026 Auto Zeitung 18 Inch Summer Tyre Test | 92% #2/3 · Top Tire Review 2026 UUHP Tyre Test | – | Different tests |
| Noise | Noise | 100% #1/10 · 2026 Auto Zeitung 18 Inch Summer Tyre Test | 100% #3/3 · Top Tire Review 2026 UUHP Tyre Test | – | Different tests |
| Abrasion | Treadwear | 73% #7/10 · 2026 Auto Zeitung 18 Inch Summer Tyre Test | 69% #4/18 · 2025 ADAC Summer Tyre Test | – | Different tests |
| Wear | Treadwear | 73% #7/10 · 2026 Auto Zeitung 18 Inch Summer Tyre Test | 58% #9/18 · 2025 ADAC Summer Tyre Test | – | Different tests |
| Fuel Consumption | Efficiency | 95% #40/50 · 2023 ADAC Summer Tyre Test | 96% #6/18 · 2025 ADAC Summer Tyre Test | – | Different tests |
| Rolling Resistance | Efficiency | 88% #5/10 · 2026 Auto Zeitung 18 Inch Summer Tyre Test | 99% #2/3 · Top Tire Review 2026 UUHP Tyre Test | – | Different tests |
| Also published by the testers (not in the score) | |||||
| Price | Cost | 73% #2/10 · 2021 Motor Summer Tyre Test | 62% #11/13 · 2023 AutoBild Sports Car Summer Tyre Test | – | Different tests |
| Value | Cost | 92% #2/10 · 2026 Auto Zeitung 18 Inch Summer Tyre Test | 33% #15/18 · 2025 ADAC Summer Tyre Test | – | Different tests |
| Overall Ranking | Overall | #9/10 2026 Auto Zeitung 18 Inch Summer Tyre Test | #2/10 2026 ACE Summer Tyre Test | – | Different tests |
Themes extracted from owner reviews found online — not the opinion of TireWheelGuide.
From Reddit, forums and review threads. Not part of our score
We haven't collected enough community discussion about this tire yet.
Community members widely praise the Continental SportContact 7 for outstanding dry and wet grip, sharp steering precision, and strong value compared to key rivals like the Michelin Pilot Sport 4S. However, users frequently highlight faster tread wear, reduced initial tread depth, and occasional issues with road noise and comfort as main drawbacks.
“My experience is as follows: SC7>PS4S's>ASY6>PS5>ASY5>PS4. I've not tried the ASY6 supersports and I think it's fair to say the PS5/4 grip better than ASY5/6, but you get a lot more feel through the goodyears. Sport contact 7 by far the best overall road tyre you can drive without going for a super aggressive tyre or semi slick.”
“On my 2nd set. Got decent mileage from them. 15k miles from the first set of rears and i've 11k on the 2nd set with 4.5mm still left on them.”
“I have the Conti SportContact 7 as summer tires on my 500hp M2 Competition. Brilliant tire, tons of grip and very direct steering, and needs much less time to get up to temp than the 4S the car came on when I got it. I can't speak for the 5 but it's definitely a stiffer tire compound than the SC7 so it will last longer but will take more time to get up to temp and also less grippy.”
Based on 114 community posts
| Attribute | A · Laufenn S Fit EQ+ | B · Continental SportContact 7 |
|---|---|---|
| Category | Summer | Summer |
| Vehicle type | Passenger Car / Crossover | Passenger Car / Crossover |
| Sizes available | 74 | 123 |
| Rim diameters | 15″ – 20″ | 18″ – 24″ |
| Tread depth | — | 8 - 9/32″ |
| UTQG | — | 240 AA A |
| Sidewall | — | Black Side Wall |
| Max pressure | — | 50 - 51 psi |
| Sizes in common | 19 | 19 |
Laufenn S Fit EQ+
Continental SportContact 7
Winner: Continental SportContact 7 — better wet, dry and treadwear. Pick the Laufenn S Fit EQ+ if noise and comfort matter most to you.
Continental SportContact 7 scores 94 vs 76 on wet.
Continental SportContact 7 scores 97 vs 82 on dry.
Continental SportContact 7 scores 68 vs 56 on treadwear.
Laufenn S Fit EQ+ scores 73 vs 62 on noise.
TireWheelGuide may earn a commission from purchases made through these links.
Continental SportContact 7, 94 vs 76 on our wet score.
Continental SportContact 7, 97 vs 82 on our dry score.
Laufenn S Fit EQ+, 73 vs 62 on our noise score.
Laufenn S Fit EQ+, 73 vs 68 on our comfort score.
Continental SportContact 7, 68 vs 56 on our treadwear score.
Neither, by our numbers: 73 vs 72 on the efficiency score, within 3 points.
Every category score blends two independent signals. 60% comes from professional tire tests (braking distances, lap times, noise measurements), each result compared with every other tire in the same test and newer tests counting more. 40% comes from owner reviews found online, adjusted for how generously each site rates. Both use one scale: the average tested tire gets 70, the best 100. When a tire has only one of the two, the missing half is estimated from the other and the score stays closer to average; with no road test and fewer than five owner reviews it gets no score yet.
Handling is the exception: road tests measure it inside the dry and wet scores, so its own row comes from owner ratings only and starts as less important.
Community buzz from Reddit and forums is shown for context only — it never changes the score. Full methodology